

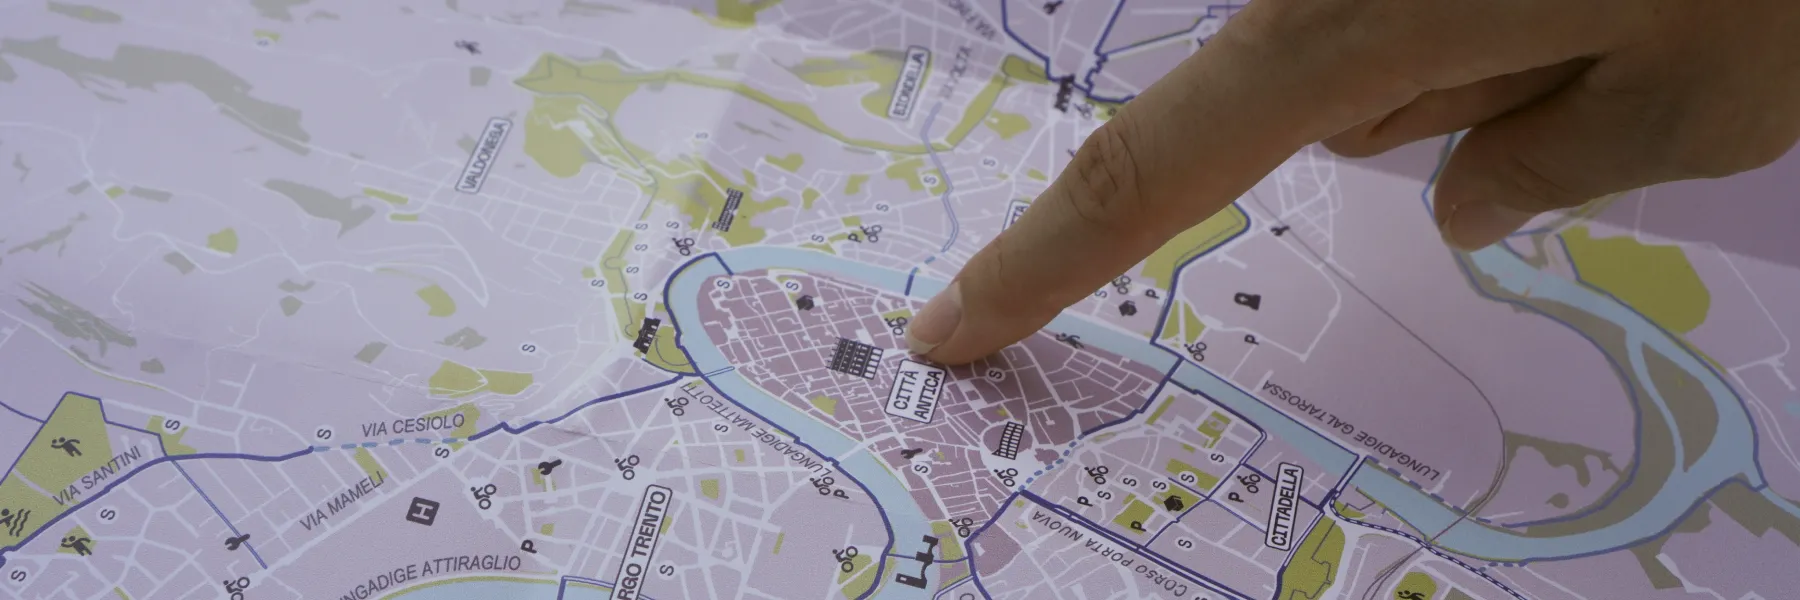
Verona Cycling Map
Volunteering project
2026 / 2 months
With COCAI and FIAB Verona for European Mobility Week
problem
Verona's cycling infrastructure has grown fast in recent years, but no usable map existed for people who wanted to navigate it. Schools and companies kept asking for one. Not even the municipality had a complete picture.
solution
A printed cycling map of Verona covering existing infrastructure, points of interest, cycling routes beyond the city, safety information, and future mobility plans, with a phygital layer via QR code.
impact
2,000 copies printed and distributed at European Mobility Week events. Now being shared with schools, companies, and local organizations across the city.
my role
Present from the first idea to the final print. I led the content strategy, mapped points of interest, designed the legend, icons, back-side sections, and defined the phygital layer.
Key outcomes
25km of routes
Traced and classified by road code typology
2,000 copies
Distributed at European Mobility Week events

Sense
A city changing faster than people can follow
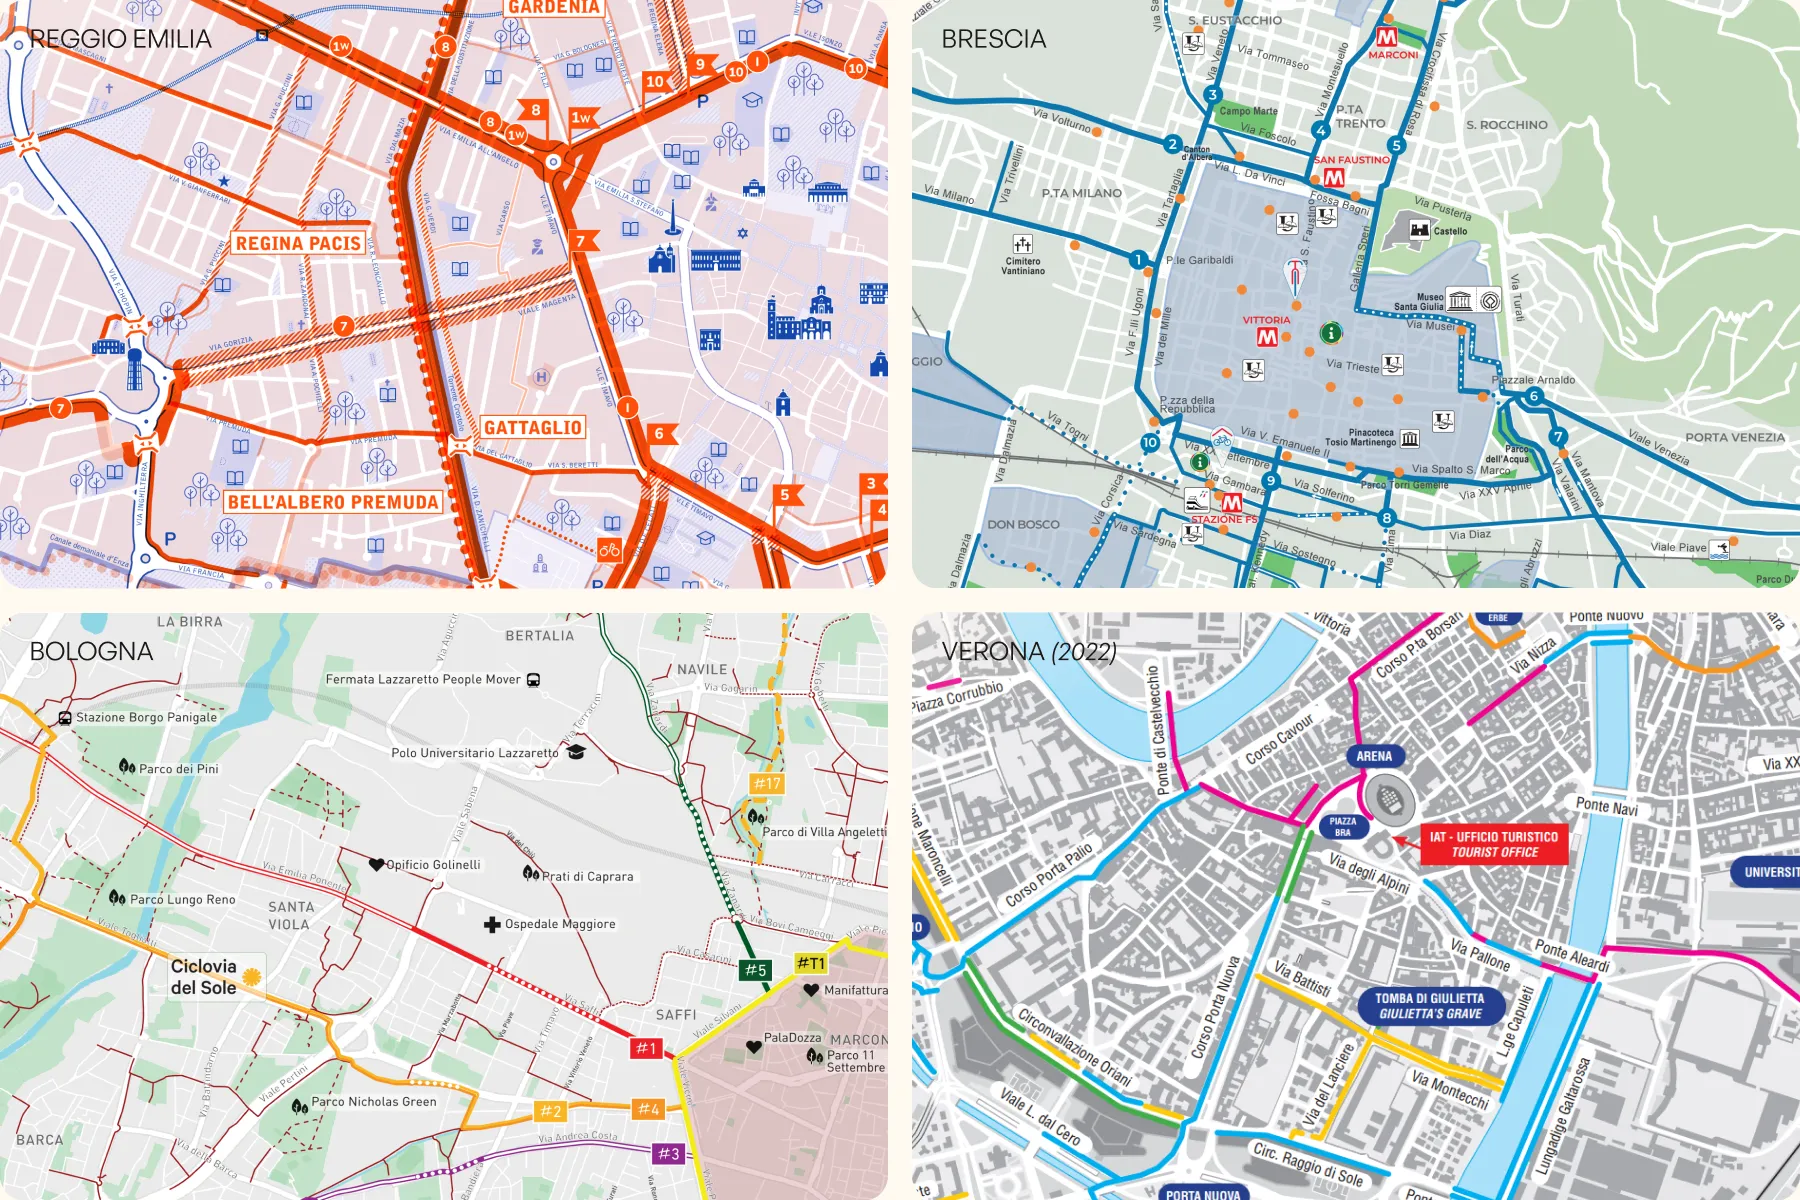
For months, every conversation with schools and companies about sustainable mobility ended the same way: someone asking if we had a map. Verona's cycling network had grown significantly, new lanes, contested removals of parking, an ongoing trolleybus construction that divided the city politically. People weren't against cycling, they just couldn't see what existed. We looked at what other cities had already done and used that as our starting point for what Verona needed.

Map
Building knowledge that didn't exist
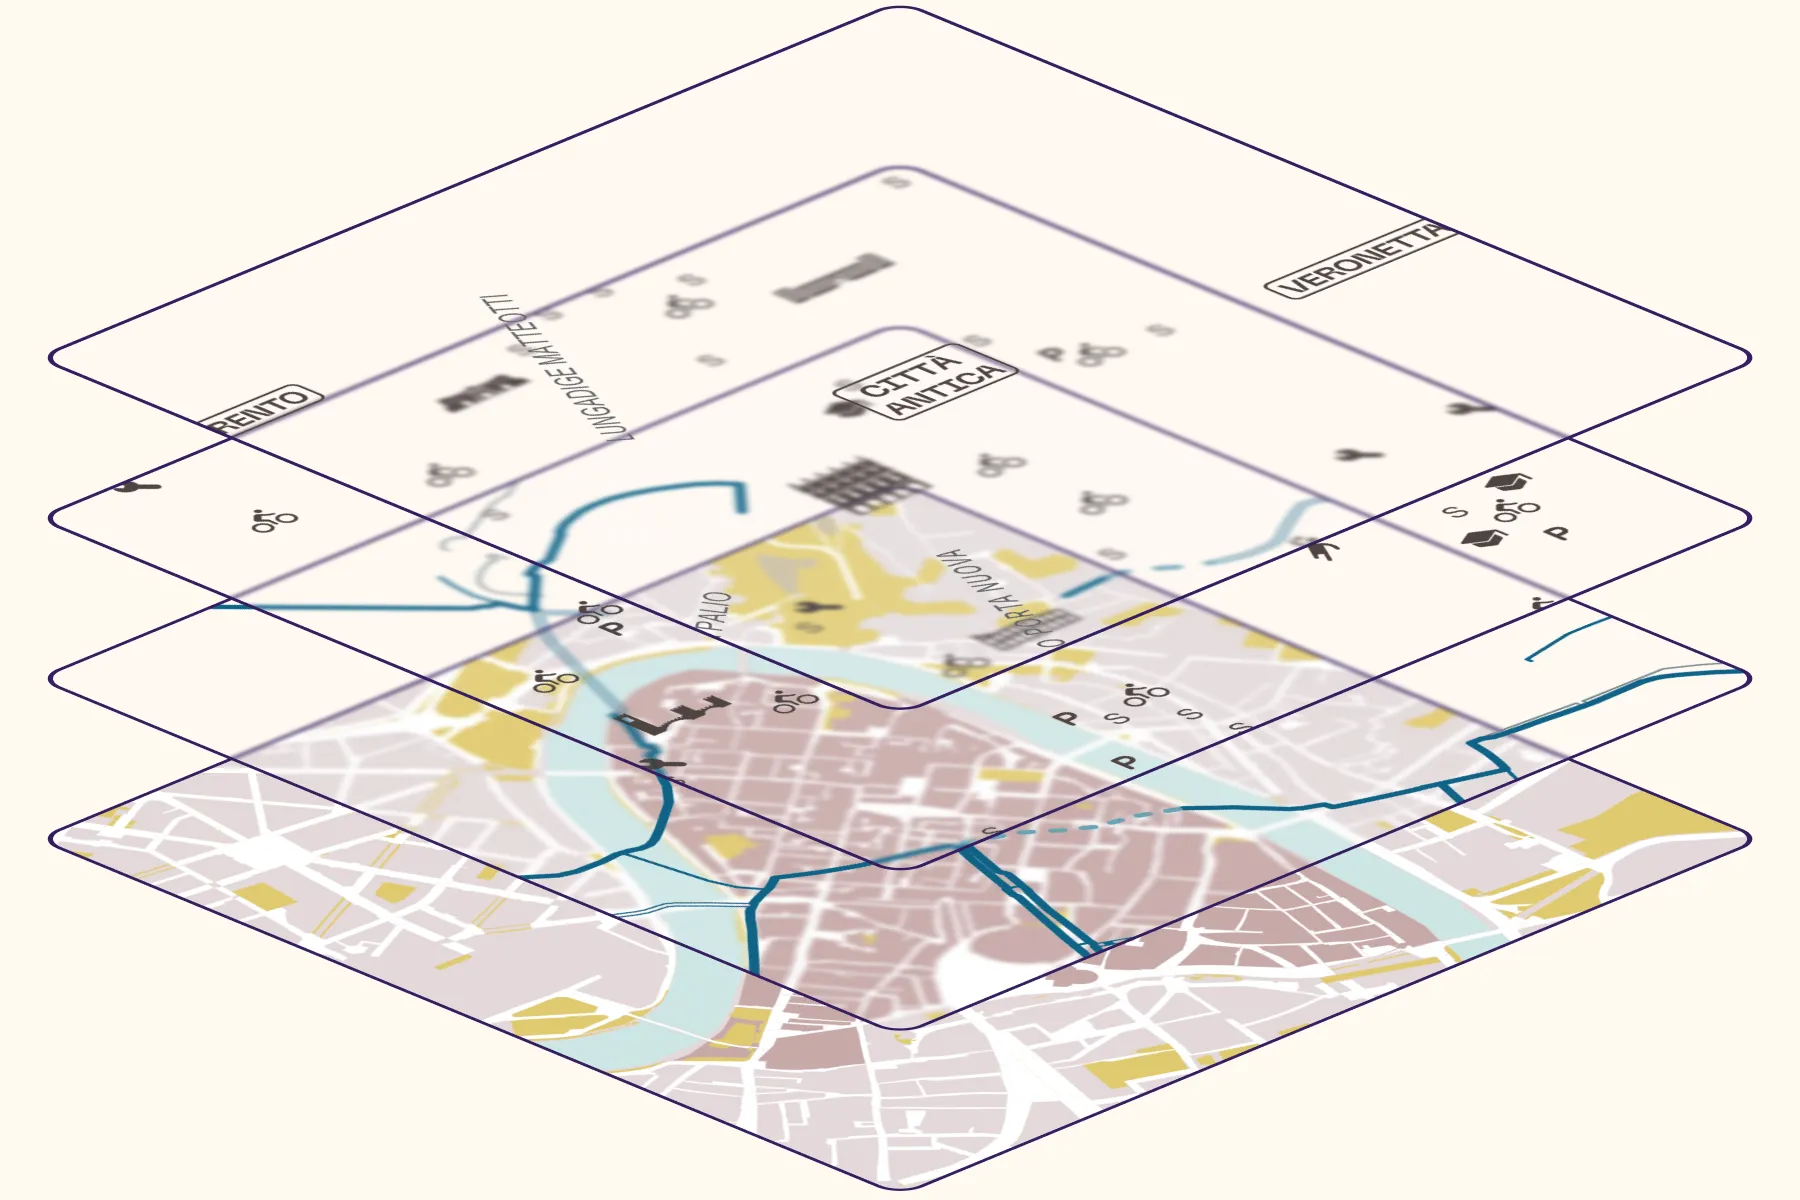
Before designing anything, we had to create the data. Over a month, we traced all existing cycling infrastructure in Verona in QGIS, classified by road code typology, and mapped everything useful to a person navigating the city by bike: parking areas, Verona Bike stations, repair points, schools, sports centers, parks, and places of interest. We pulled from OpenStreetMap, municipal sources, and manual surveying. Not even the municipality had this picture assembled in one place.

Design
Making complexity readable
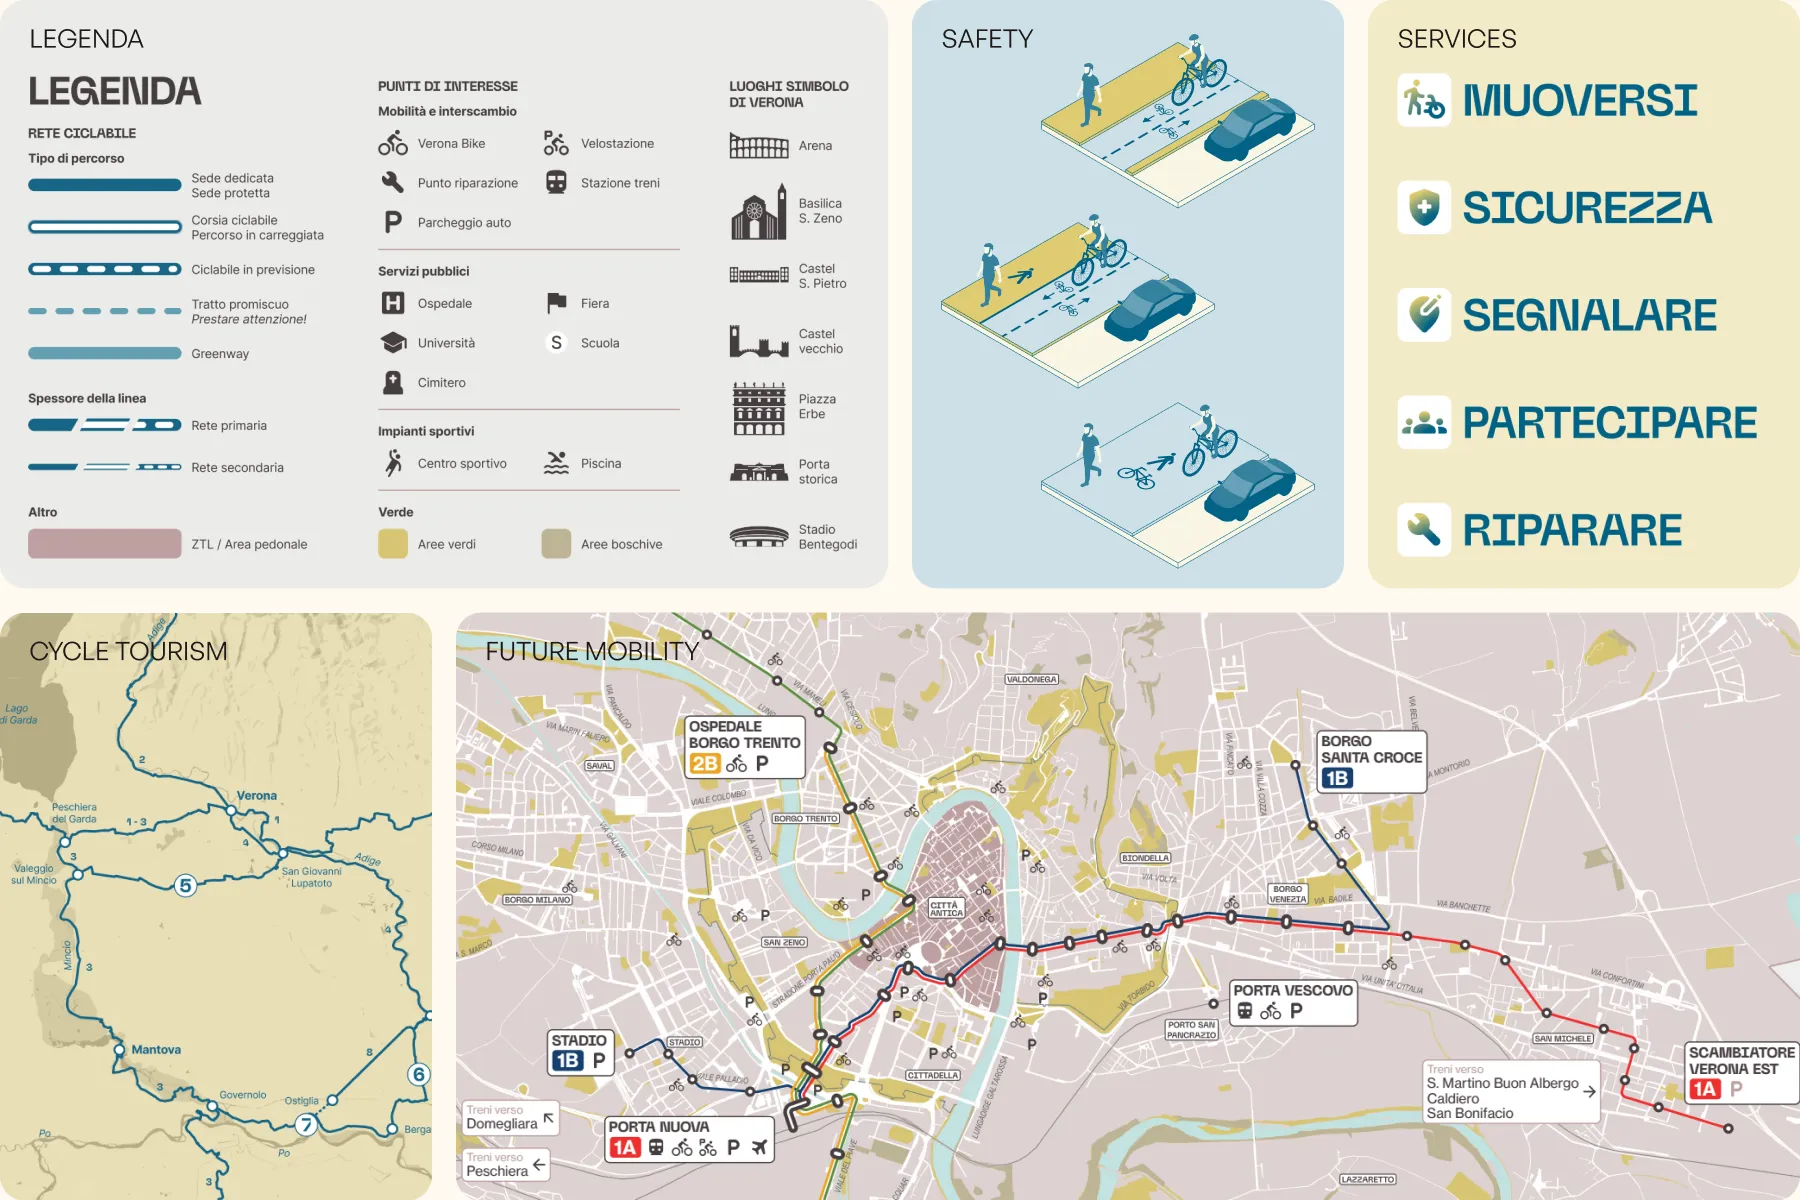
All that data had to become something a person could unfold and read easily. We designed a simple legend system, created custom icons, and built a visual hierarchy that showed infrastructure type without requiring the reader to know the road code. The back side carried everything that a map alone couldn't: cycling routes beyond the city, a guide to the types of cycling lanes with illustrations, a summary of cyclist rights and duties, a directory of mobility services accessible via QR code, and a section on Verona's future mobility plans including the trolleybus network.

Build
A pilot designed to grow
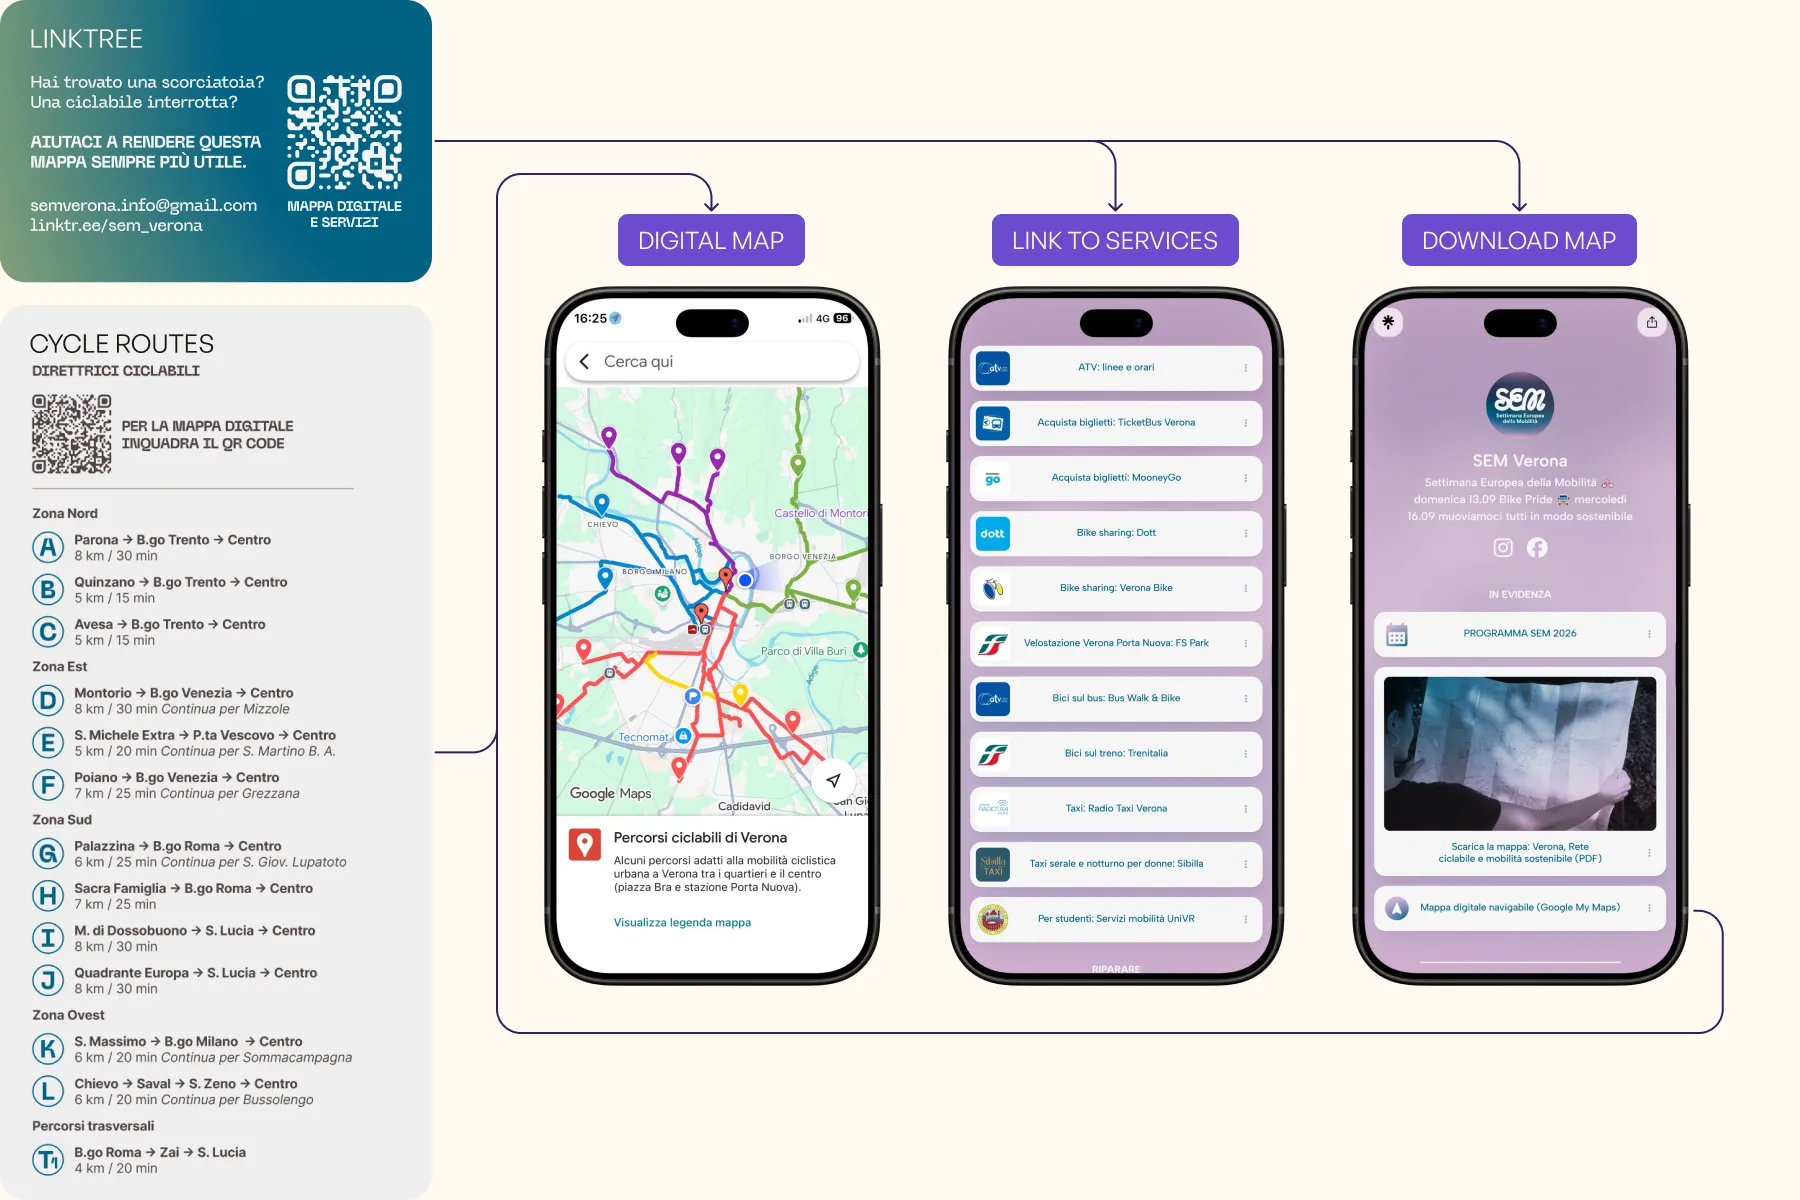
A QR code on the map connects to a curated Linktree with all relevant digital services: bike sharing, repair shops, route planning tools. This phygital layer means the printed map stays lightweight while pointing to information that changes over time. The map is explicitly a first version. Schools and companies have already asked for copies. The infrastructure is in place to update it annually, expand it collaboratively, and eventually build it into a feedback tool for the cycling network itself.

Tell
Distributed at the right moment
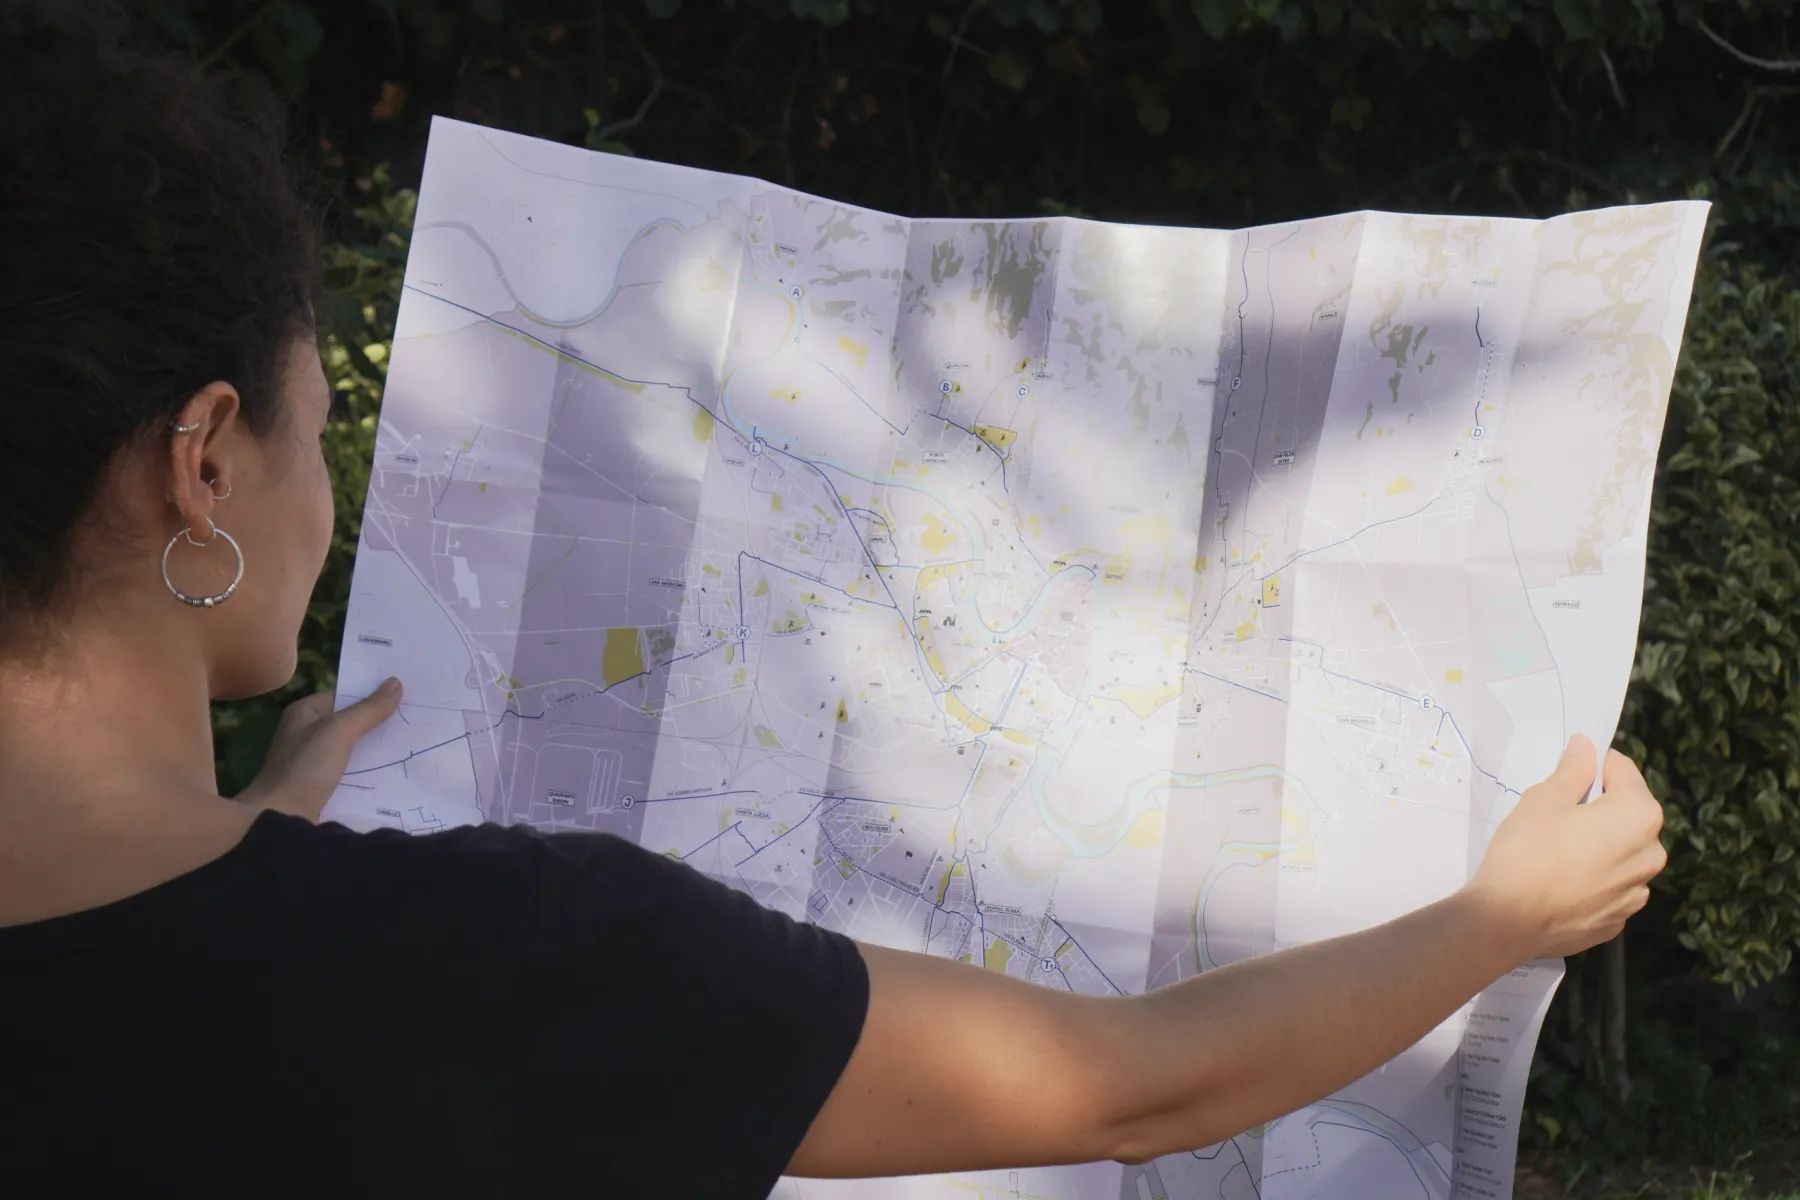
The map launched during European Mobility Week, reaching people already engaged with sustainable mobility. From there it moved into schools, companies, and social media. The goal was never just distribution: it was starting a conversation about what a city that works for cyclists actually looks like. A map is a political object. It shows what exists, what is planned, and implicitly what is missing. This one is the beginning of that argument, not the end.
key learnings
Mapping is a form of knowledge production. Before this map existed, the cycling network existed but was invisible as a system. Making it legible changed how people talked about it, including within the organizations working on urban mobility. You cannot advocate for what you cannot see.
Work like this deserves proper funding. A project of this scope, data collection, design, cartography, content strategy, print production, takes months of skilled work. Doing it as volunteering gets it done, but it also makes it fragile. The next step is finding a model that makes it sustainable.

